Habits Power BI Report
I have always been meticulous about tracking my habits, using Notion to log everything. Recently, I decided to visualize this data, so I turned to Power BI. I wrote a Python script to pull data from Notion into Power BI using Power Query and created another script to calculate my habit streaks. The result is a detailed, insightful report that keeps me on track and motivated.
Pages
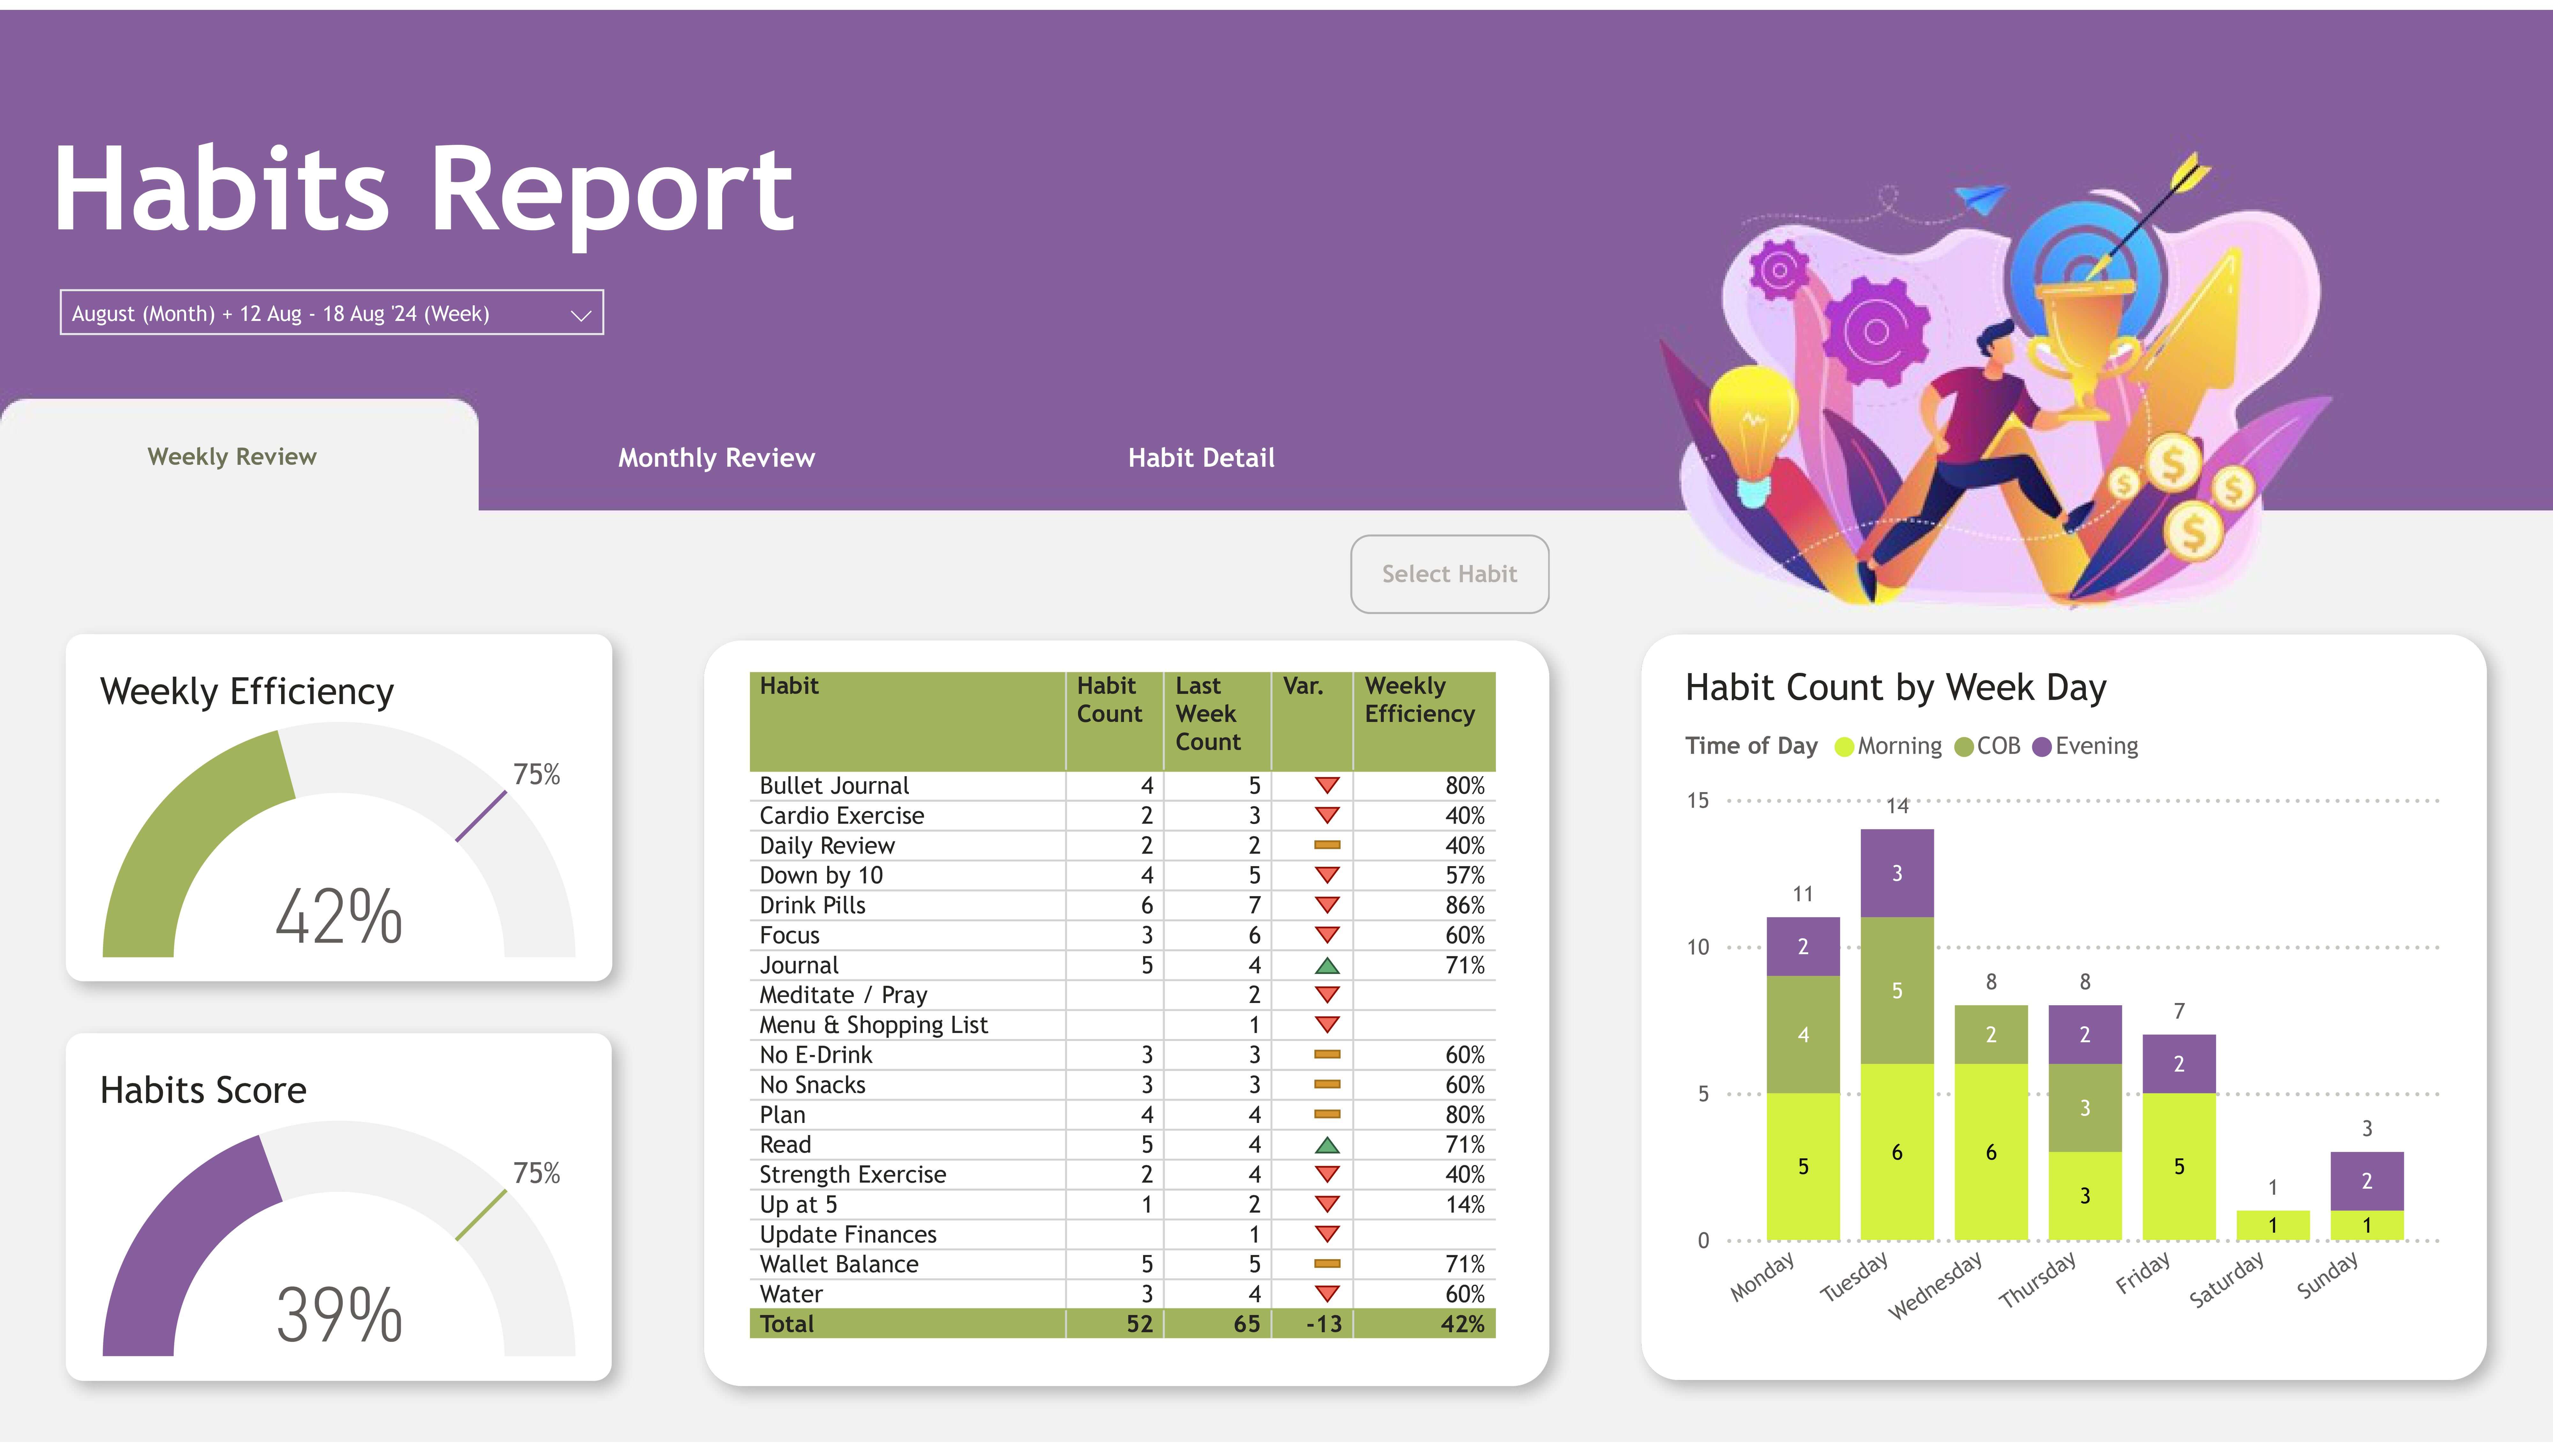
Weekly Review: A Snapshot of Progress
The first page of my report is a weekly review that gives me a clear view of how I've performed each week. It features a bar chart showing how many times I completed each habit daily, plus a weekly efficiency gauge to see how close I am to my targets. My habit score, which tracks my progress over time, is also highlighted.
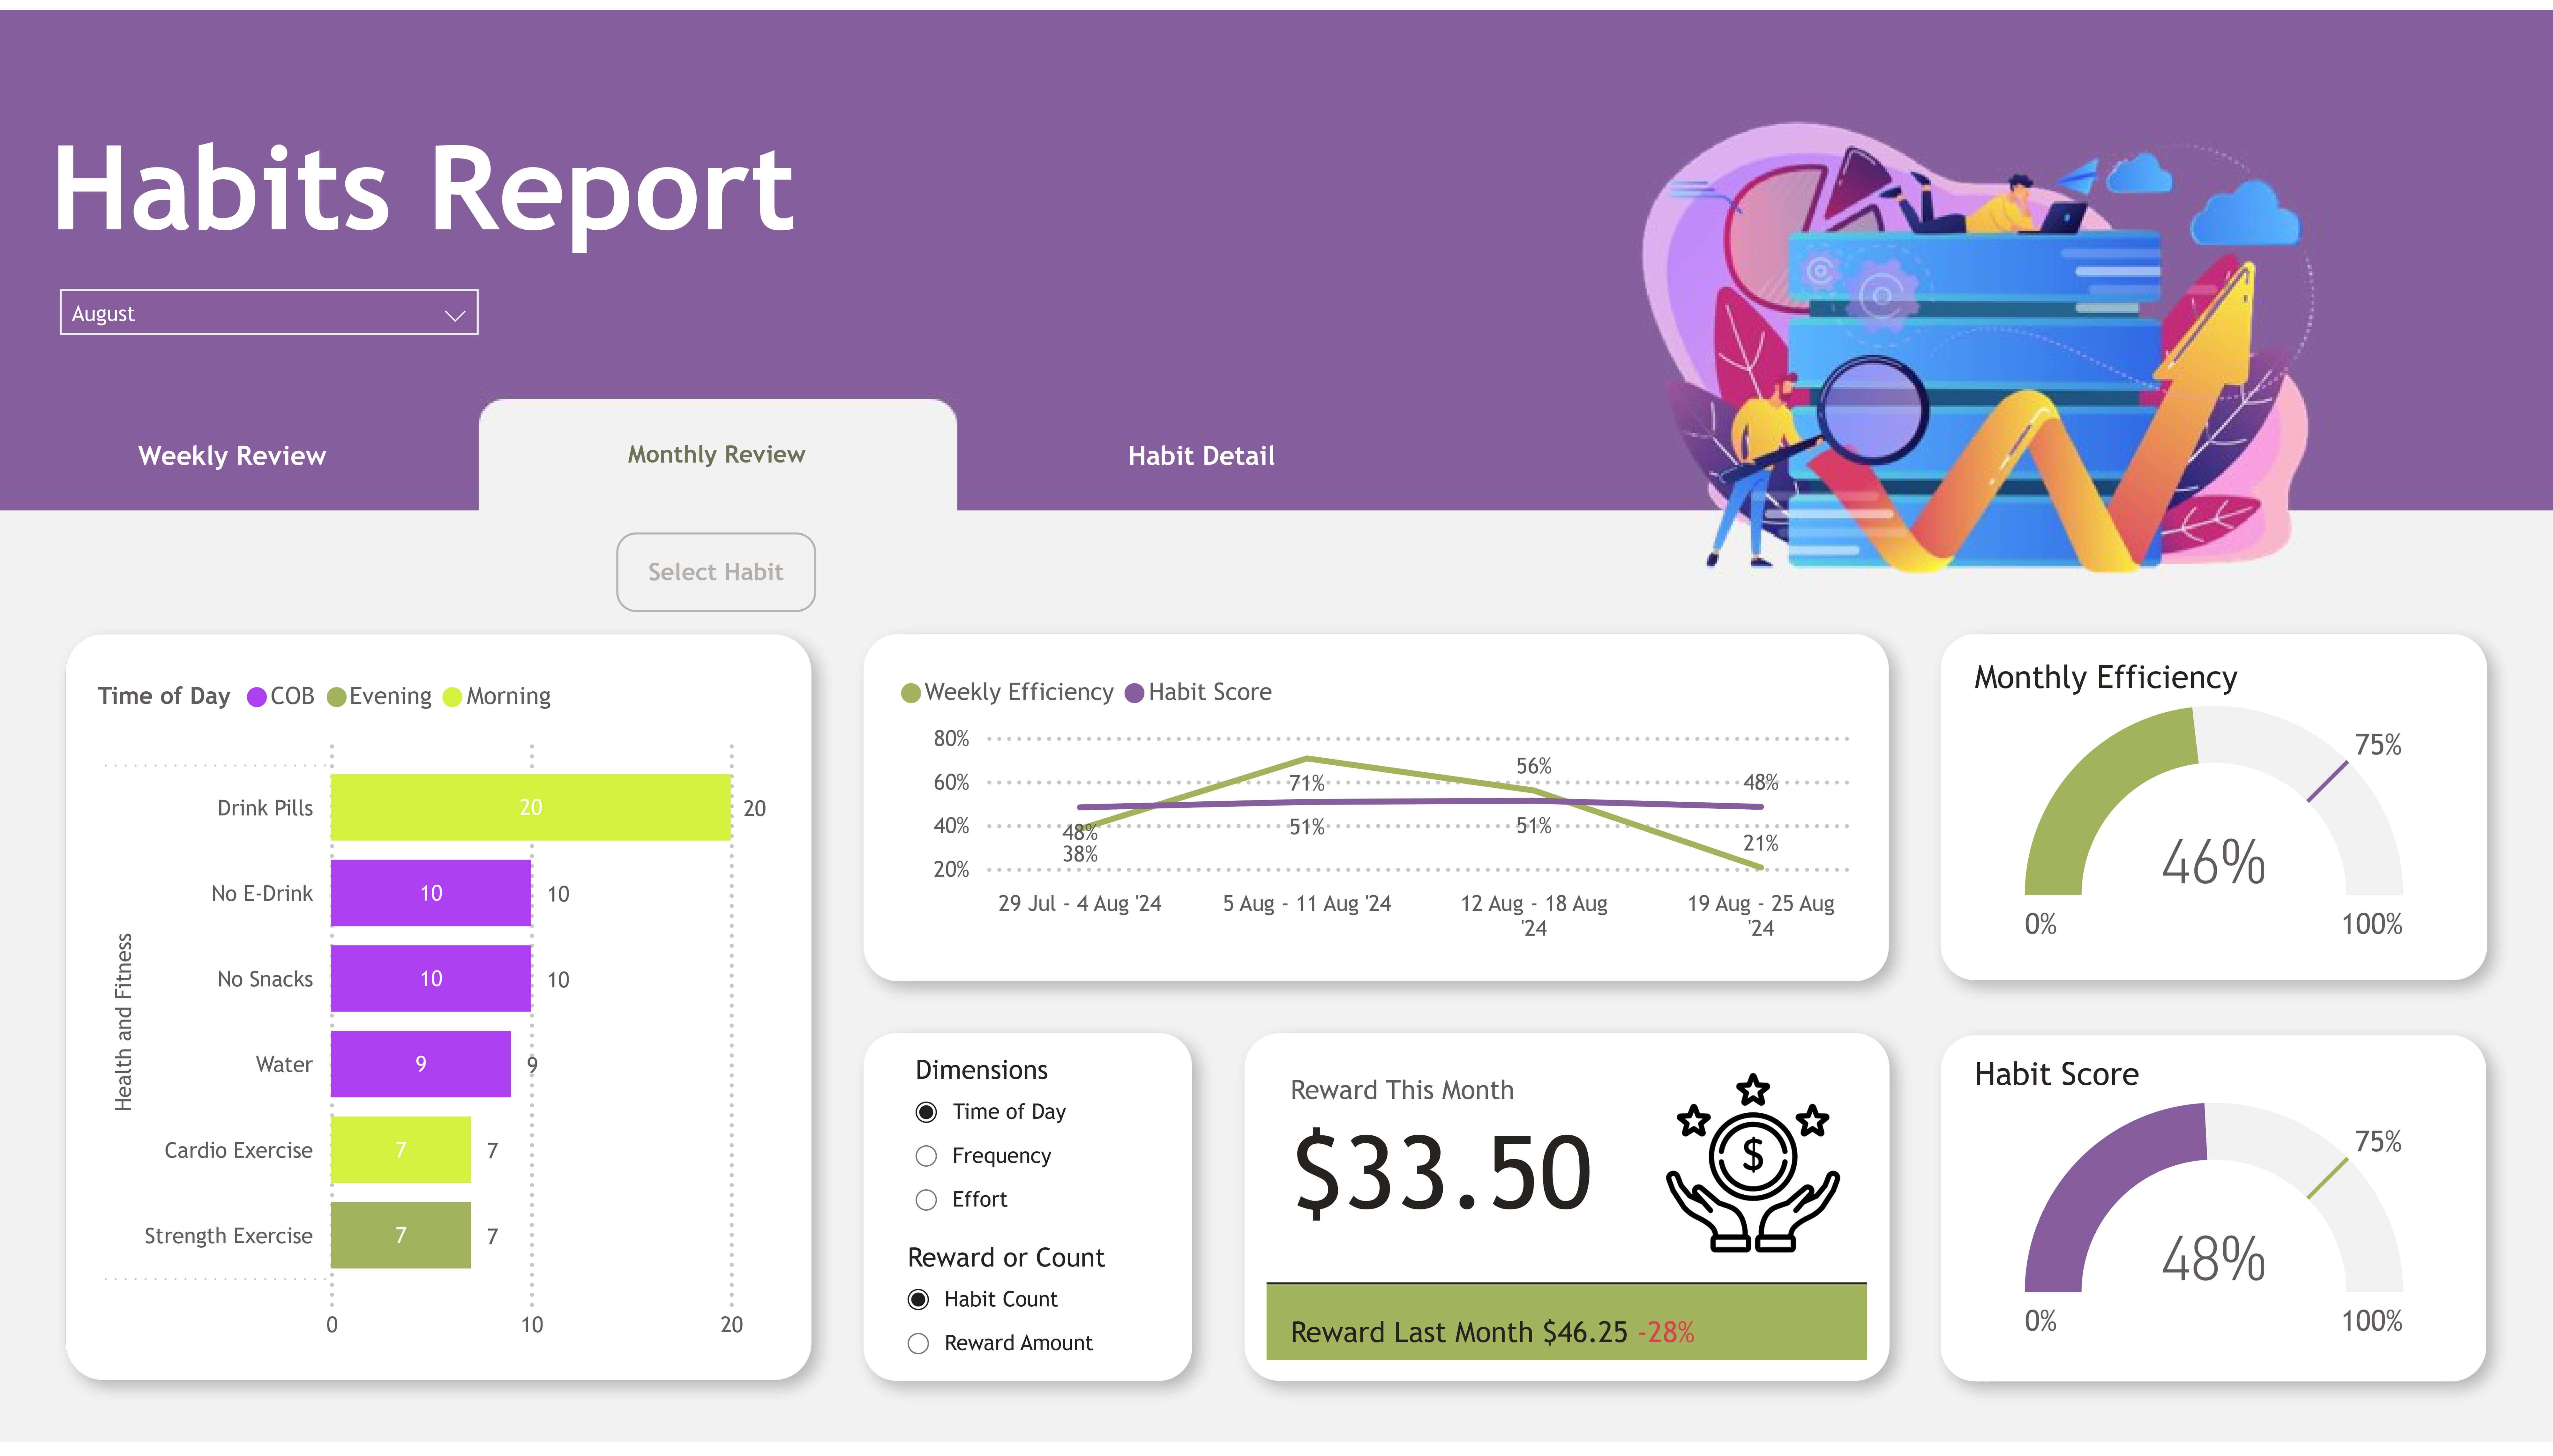
Monthly Review: Categorizing and Analyzing Habits
The second page focuses on the monthly review, where habits are grouped into categories. A dynamic bar chart with field parameters lets me explore habits by different dimensions, such as time of day, effort level, and frequency. I’ve also added a rewarding system where I assign a monetary value to habits based on their difficulty and frequency, which keeps me motivated to stick with them.
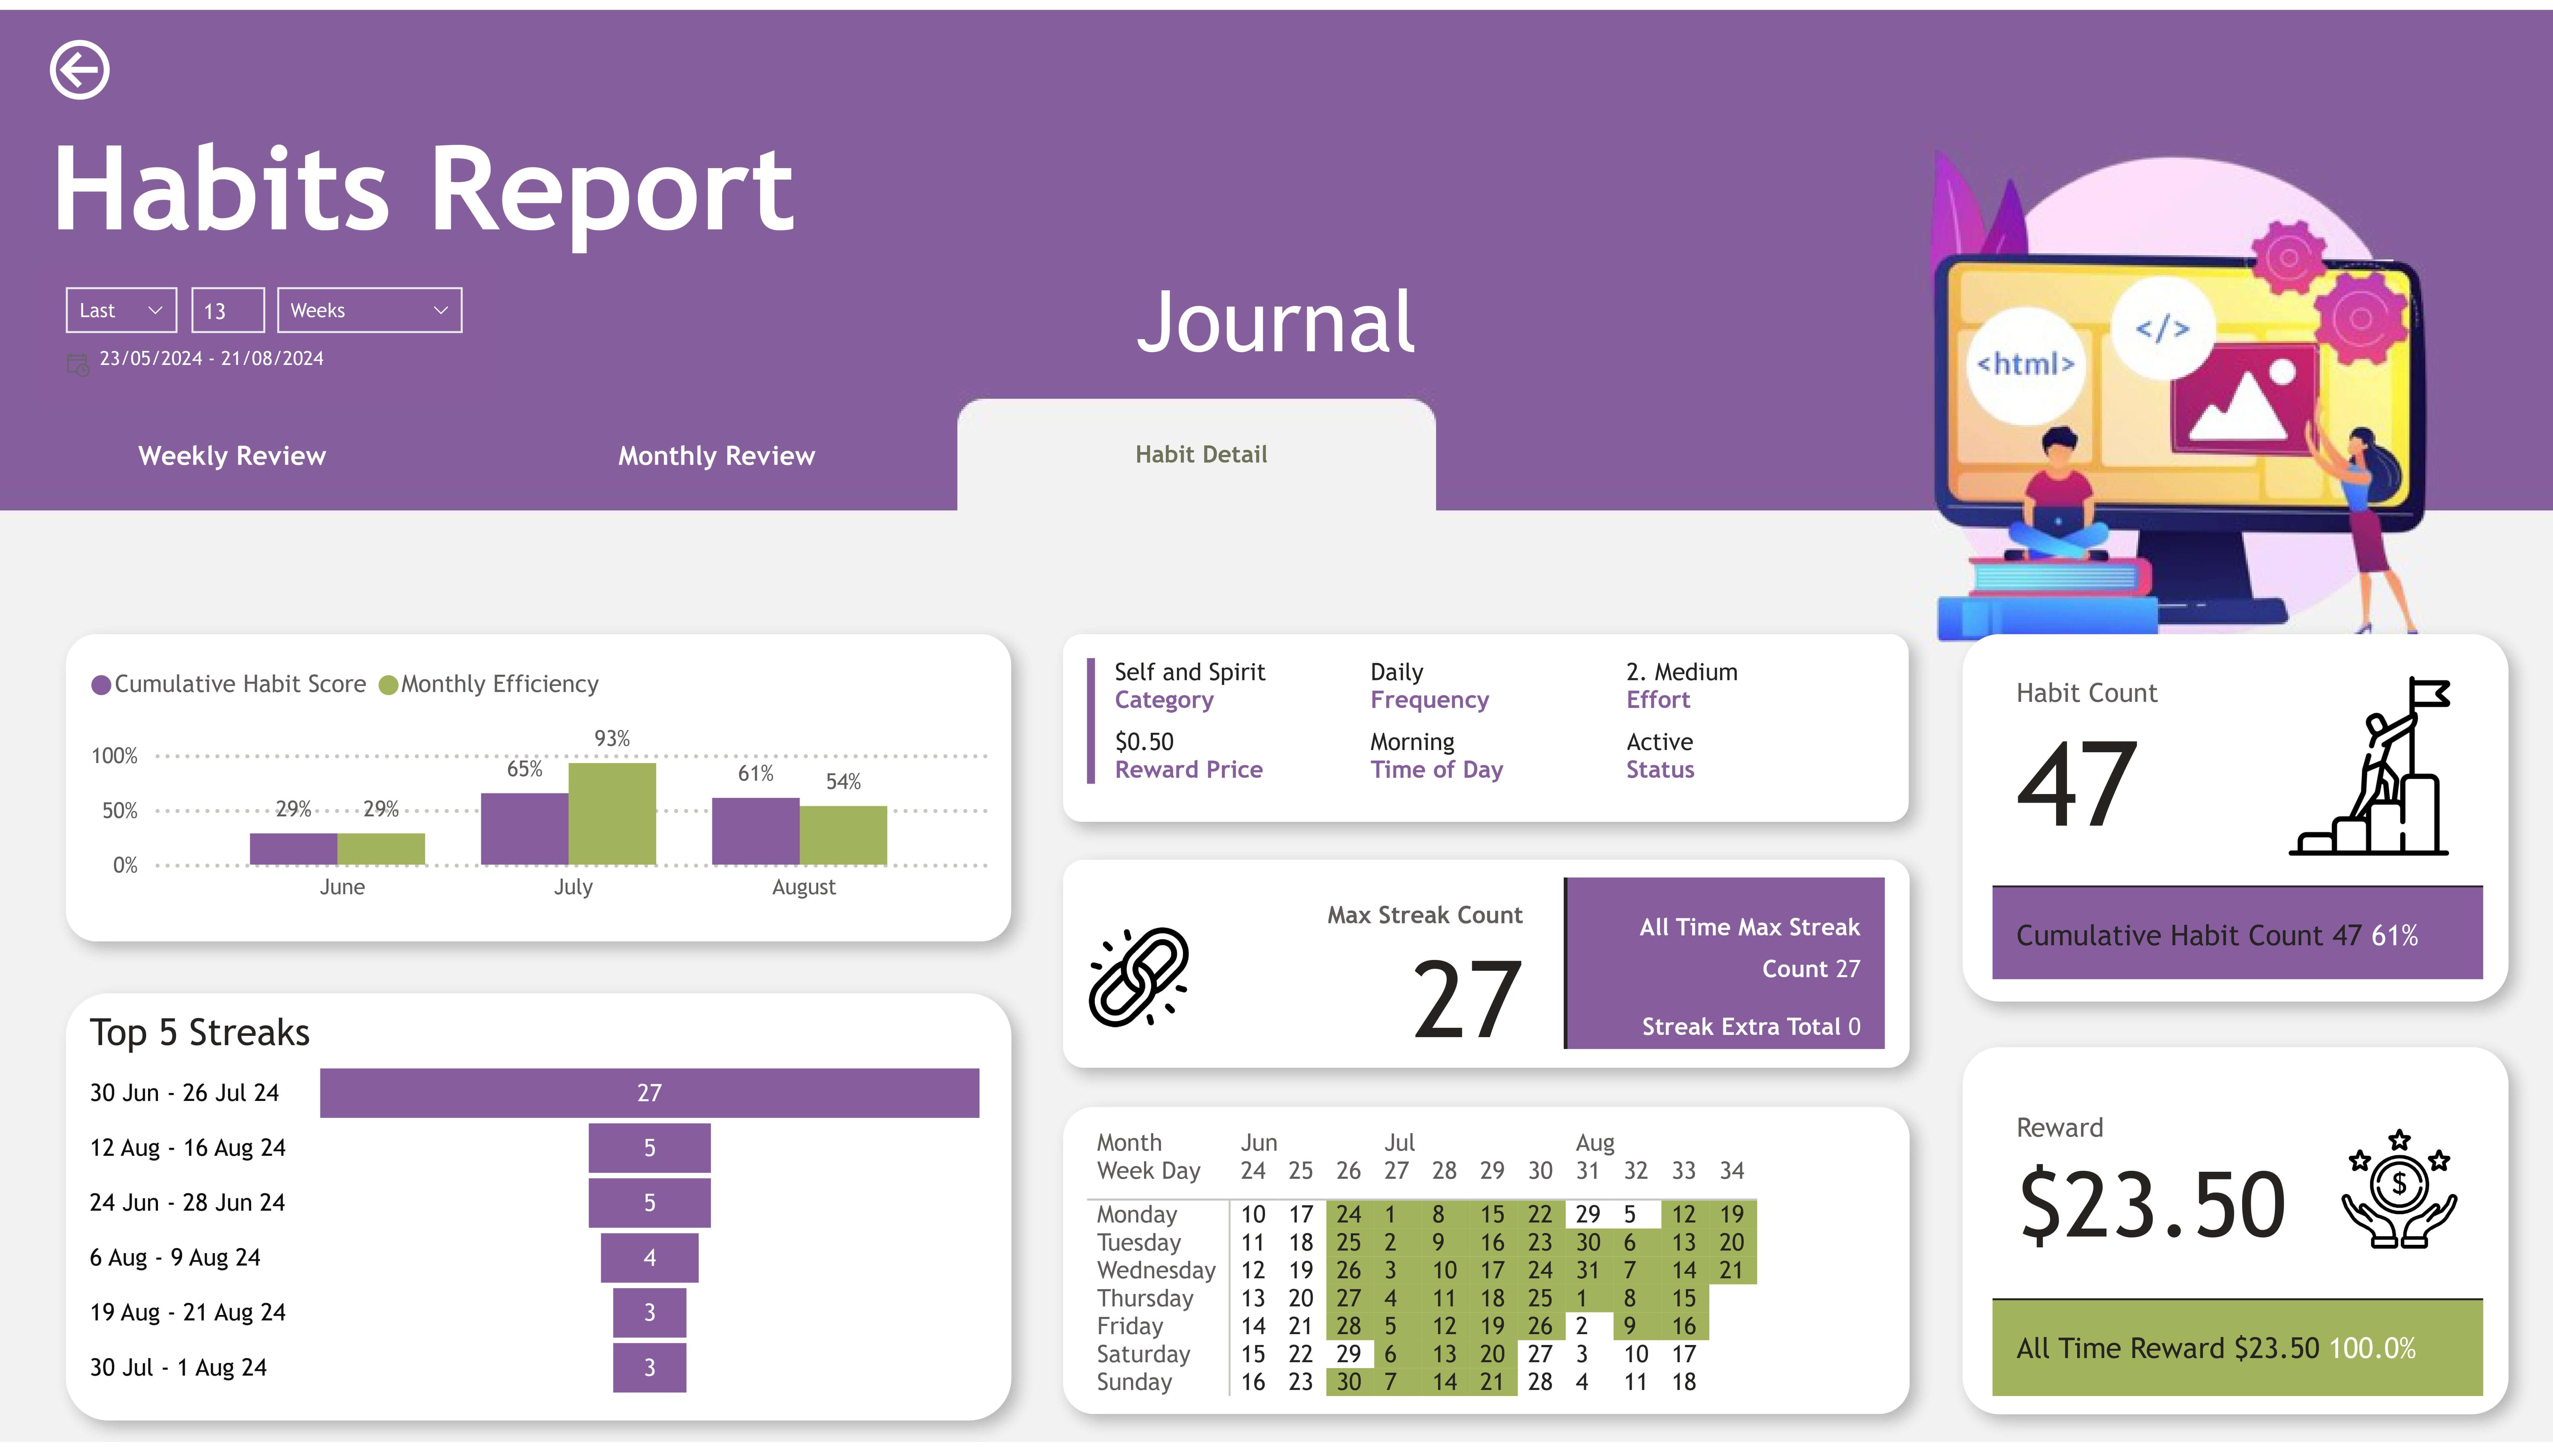
Habit Detail: Digging Deeper
For those who want to dive deeper, the habit detail page is accessible through drill-throughs from the weekly or monthly review. This page offers a more detailed view, including streaks—both current and all-time best—and a calendar to visualize habit completion. It’s a fantastic way to celebrate wins and identify areas where I can improve.